Probabilities
The Binomial Engine Behind Every Drop
Every Plinko drop in BGaming Original Plinko is a sequence of independent peg collisions. At 16 rows the ball bounces 16 times, and each bounce sends it left or right. If you treat each bounce as a fair binary event, the number of right-turns out of 16 follows a binomial distribution with n equal to 16 and p equal to 0.5. The pocket the ball lands in is determined entirely by how many of those 16 bounces went right, which is why there are exactly 17 pockets at 16 rows: the outcomes range from zero right-turns to sixteen right-turns.
The probability of any specific pocket k is the binomial coefficient C(16, k) divided by 2^16, which is 65,536. The centre pocket, corresponding to eight right-turns, has probability C(16, 8)/65,536, which works out to 12,870/65,536, or roughly 19.6 percent. That single number explains the entire visual shape of the game: the pyramid of pegs manufactures a bell curve, and the payout table is built on top of that curve. Centre pockets are cheap multipliers because they are common; edge pockets carry enormous multipliers because they are vanishingly rare.
Understanding this matters more than any pattern-spotting habit. The ball has no memory of previous drops, the pegs do not heat up, and the distribution does not drift. Every drop redraws from the same binomial distribution. You can explore how changing the row count reshapes this curve with the interactive odds calculator, which shows pocket-by-pocket probabilities at 8, 12 and 16 rows.
- 16 rows produce 17 pockets, indexed by the count of right-turns from 0 to 16.
- Each pocket probability equals C(16, k) / 65,536 under fair binary bounces.
- The centre pocket is the single most likely outcome at roughly one drop in five.
- The distribution is symmetric: pocket k and pocket 16 minus k are equally likely.
One Edge Versus Either Edge: The Worked Calculations
The most quoted Plinko number is the edge-pocket probability, and it is also the most frequently misquoted. At 16 rows, hitting one specific outer pocket, say the far left, requires all 16 bounces to go the same direction. There is exactly one such path out of 65,536, so the probability is 1/65,536. Hitting either edge, left or right, doubles that to 2/65,536, which simplifies to 1/32,768. Players who quote 1 in 65,536 while thinking about either edge are off by a factor of two, and that error compounds badly when they estimate waiting times.
Row count changes these numbers dramatically. At 12 rows the total number of paths is 2^12, or 4,096, so either edge lands at 2/4,096, which is 1/2,048. At 8 rows there are 256 paths, so either edge lands at 2/256, which is 1/128. Moving from 16 rows down to 8 rows makes an edge hit 256 times more likely, which is precisely why the edge multipliers shrink as rows decrease. The payout table and the path count are directly linked: the game can afford a 1000x edge multiplier at high risk on 16 rows because that event is expected roughly once per 32,768 drops.
The centre tells the opposite story. At 16 rows the centre pocket appears about once per five drops, and its multipliers reflect that abundance: 0.5x on low risk, 0.3x on the Normal (medium) setting, and 0.2x on high risk. Notice that all three centre multipliers are below the 1 FUN stake, meaning the single most common outcome in the game is a partial return, not a profit. This is the mechanical reason most individual drops lose money even though the game advertises four-figure multipliers.
- 16 rows: one edge 1/65,536, either edge 1/32,768.
- 12 rows: either edge 1/2,048.
- 8 rows: either edge 1/128.
- Centre pocket at 16 rows: roughly 19.6 percent, paying 0.5x, 0.3x or 0.2x depending on risk.
Chance of at Least One Hit Over N Independent Drops
A question that appears constantly in Polish discussions, in forms like how long until the big pocket hits, is answered by the complement rule. If a single drop hits a target pocket with probability p, then the probability of missing on every one of N independent drops is (1-p)^N, so the probability of at least one hit is 1-(1-p)^N. Independence is doing the heavy lifting in that formula: each drop starts fresh, so the miss probabilities multiply.
Worked example with the 16-row either-edge probability of 1/32,768. Over 1,000 drops, the chance of at least one edge hit is 1-(32767/32768)^1000, which is approximately 3.0 percent. Over 10,000 drops it rises to roughly 26.3 percent. Even over a full 32,768 drops, the so-called expected waiting time, the chance of at least one hit is only about 63.2 percent, because 1-(1-1/n)^n converges to 1 minus 1/e. There is no drop count that guarantees an edge hit; there are only rising probabilities that asymptote toward certainty.
This formula also exposes a common budgeting mistake. A player who reasons that the edge is due after 30,000 misses is committing the gambler’s fallacy: the 30,001st drop still has probability 1/32,768. The complement rule describes the behaviour of a block of future drops, not a debt the game owes you. When you test session lengths in the Plinko simulator, you will see long stretches with no edge hit punctuated by occasional clusters, and both are fully consistent with the mathematics.
Expected Count Versus Guaranteed Wait
The expected number of edge hits in N drops is simply N times p. Over 32,768 drops at 16 rows, the expected count of either-edge hits is exactly one. But an expectation is an average over infinitely many repetitions, not a promise for any single session. The actual count in a fixed block of drops follows a binomial distribution of its own: in 32,768 drops you might see zero edge hits, one, two, or occasionally five, and the probability of seeing zero is about 36.8 percent.
The guaranteed wait, by contrast, does not exist. Because drops are independent, no finite number of drops makes a rare pocket certain. The median wait for an either-edge hit at 16 rows is about 22,714 drops, meaning half of all waiting runs end before that point and half run longer. Roughly one run in a hundred exceeds 150,000 drops without a single edge hit. A player who sizes a bankroll around the expected wait of 32,768 drops will be ruined in the unlucky half of cases where the wait runs longer.
Distinguishing these two ideas, average frequency and worst-case wait, is the single most useful habit for interpreting rare multipliers. The expected count tells you what the payout table can afford; the distribution of waits tells you what your bankroll must survive. Our recorded FUN-credit sessions, shown in the results evidence module, illustrate how observed counts sit inside these theoretical ranges without ever confirming them exactly.
What is the math behind Plinko?
For an ideal board with n independent, equally likely left-or-right steps, the chance of pocket k is C(n,k) / 2ⁿ. C(n,k) counts the different paths reaching that pocket. This binomial model explains why the centre appears often: many paths lead there, whereas a specific edge requires every step in the same direction.
With 16 rows there are 65,536 equally likely paths. One edge has probability 1/65,536; either edge has probability 1/32,768. The centre has 12,870 paths, or about 19.64%. These are model probabilities, not measured hit rates in a 1,000-drop sample. They do not automatically describe a physical television board or every digital product carrying the Plinko name.
Expected return is the sum of each pocket’s probability multiplied by its payout multiplier. A pocket can be common and still lose money when it returns less than 1×. Use the calculator on this page to compare one edge with both edges, then check the observed results separately. Moving the risk selector changes the payouts; it is not a method of steering the ball.
RTP and payouts
Stake, Gross Payout and Net Result
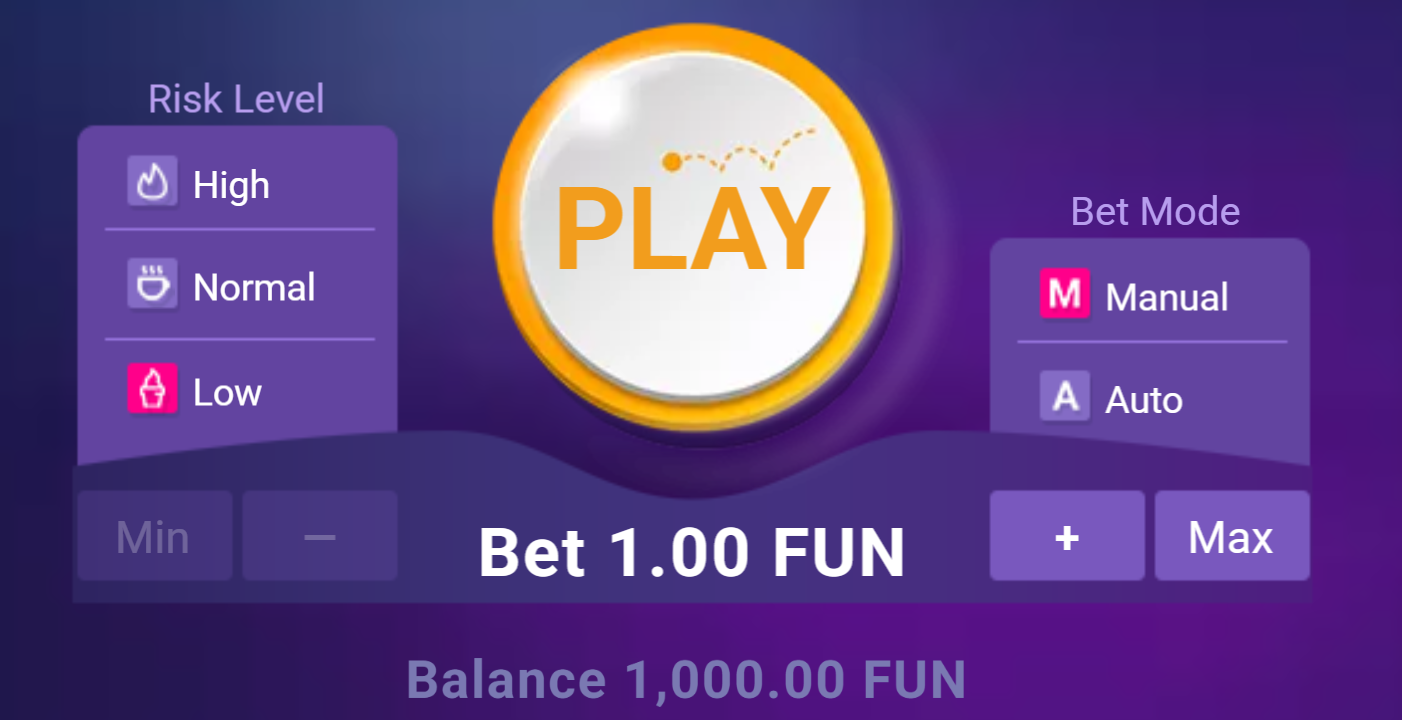
Three numbers get conflated in casual Plinko talk, and separating them prevents most beginner errors. The stake is what you pay per drop, 1 FUN in the standard test configuration. The gross payout is what the game returns: stake multiplied by the pocket multiplier. The net result is gross payout minus stake. A 0.3x centre hit on a 1 FUN stake returns 0.3 FUN gross, which is a net loss of 0.7 FUN, even though the game displays a win animation and credits your balance.

This distinction is why the rule semantics in our testing define loss as any payout below stake, profit as any payout above stake, and break-even as exactly stake. Under that definition, the majority of drops on every risk level are losses, because the centre band of pockets pays partial returns. A purely hypothetical illustration in PLN: if a drop cost 5 PLN and returned 0.3x, you would receive 1.50 PLN and be 3.50 PLN down, despite the screen celebrating. The recorded credits in all our sessions remain FUN, the game’s demo currency, and no real-money play is involved anywhere in this research.
The confusion matters strategically because progression systems react to net results, not gross ones. Martingale, for example, doubles after a loss and resets after a profitable result, but partial payouts make the naive 2x recovery assumption invalid. Doubling your stake after a 0.3x return does not recover anything, because the previous drop already lost 70 percent of its stake. Any staking plan that treats a partial return as a push or a win is misreading the ledger.
- Stake: the per-drop cost, fixed at 1 FUN in standard tests.
- Gross payout: stake times the pocket multiplier, the number the game animates.
- Net result: gross minus stake, the only number that moves your bankroll.
- Partial returns below 1x are losses by definition, regardless of animation.
Return Percentage, Frequency of Profit and Why They Diverge
Return to player, RTP, is the long-run average of gross payout divided by stake, computed across the full pocket distribution. It is a weighted mean: each pocket’s multiplier times its binomial probability, summed. RTP says nothing about how that return is delivered. Two games with identical RTP can feel completely different, one paying frequent small amounts and the other paying almost nothing for thousands of drops before a single enormous hit.
Frequency of profit is a separate statistic: the proportion of drops whose payout exceeds stake. In Plinko this frequency is low by construction, because the high-probability centre pockets all pay below 1x. On the Normal risk setting the centre pays 0.3x, and the pockets adjacent to it also tend to pay partial returns, so profitable drops live in the outer thirds of the board where binomial probability thins out fast. You can experience a session with a healthy number of returned credits and still have a negative net, because most of those returns were partial.
This is the direct answer to the Polish question about not confusing return with profit. A 99 percent RTP does not mean you keep 99 percent of your balance after a session. It means the average drop returns that fraction of its stake over enormous samples, with the shortfall concentrated in the cost of chasing rare pockets. Session results in FUN credits swing far above and below the theoretical return, and the risk and row settings you choose determine how violently they swing, not whether the average changes.
Variation and sample size
Standard Deviation and Drawdown: The Cost of the Tail
Standard deviation measures how far a single drop’s payout typically sits from the average. In Plinko it is dominated by the tail: a 1000x edge multiplier at high risk contributes enormously to variance even though it lands roughly once per 32,768 drops. When it lands, it moves the sum by a thousand stakes at once. High risk on 16 rows is therefore a high-variance configuration: long sequences of 0.2x and similar partial returns, interrupted by rare large payouts. Low risk compresses the multiplier range, cutting variance, which is why low-risk sessions show smoother balance curves.
Drawdown is the practical consequence: the largest peak-to-trough decline in your bankroll during a session. With a 1,000 FUN ordinary bank and 1 FUN stakes, a high-risk session can easily draw down several hundred FUN through nothing more than ordinary centre-band results. Each drop leaks a fraction of a stake on average, and the rare recoveries may not arrive within your sample. Drawdown is not a sign that something is broken; it is the expected texture of a negative-expectation, high-variance game.

Stop limits interact with drawdown in a specific way worth understanding. Our stop rules check settled net against minus 20 and plus 20 FUN thresholds, and they can overshoot, because the check happens after a drop settles, not mid-flight. A stop-loss at minus 20 does not cap your loss at 20; it stops the sequence at the first settled result beyond that line, which may be minus 21 or minus 24. Treating stop limits as hard caps is another form of the guaranteed-wait fallacy.
- Variance is set by the multiplier table and row count, not by staking style.
- High risk at 16 rows concentrates return in rare tail events.
- Drawdown of several hundred FUN on a 1,000 FUN bank is normal at high risk.
- Stop limits trigger after settlement and can overshoot their thresholds.
Why a Small Sample Cannot Measure Rare Tails
Suppose you play 1,000 drops at 16 rows, which is exactly the per-risk sample size in our testing. The either-edge probability is 1/32,768, so your expected count of edge hits is about 0.03. In roughly 97 percent of such 1,000-drop samples you will see zero edge hits. If your sample happens to contain one, your observed edge frequency is 1 in 1,000, overstating the true rate by a factor of more than thirty. Neither outcome tells you anything reliable about the tail, because the sample is thirty times smaller than the event’s natural timescale.
The same logic applies to RTP estimation. Because a single 1000x hit contributes 1,000 stakes of gross payout, whether or not your sample contains one swings the measured return by an entire stake per drop at a 1,000-drop sample size. A session measured at 60 percent RTP and one measured at 130 percent RTP can be statistically indistinguishable once you account for tail variance. Honest measurement of this game requires either vastly larger samples or confidence intervals wide enough to admit the uncertainty, and our evidence module reports observed counts with that caveat rather than pretending a thousand drops settle anything.
This is also why each risk level in our testing is a separate 1,000-drop recording rather than one blended stream. Keeping the samples clean and comparable matters more than any betting pattern, because methodology determines whether your numbers mean anything at all. If you want to feel the effect directly, run short sessions in the free Plinko demo and watch how wildly the measured return jumps around between sessions of a few hundred drops.
Staking Systems: What Each One Actually Does
Every common staking hypothesis was tested under identical conditions: 1,000 paid drops per risk level at 1 FUN base stake, with a 1,000 FUN ordinary bank and a 100 FUN stake cap. Fixed stake is the baseline. Percentage staking starts at 1 percent of the current bank, so at a 1,000 FUN bank it stakes 10 FUN, not 1 FUN, and rescales as the bank moves. Martingale doubles after each loss and resets after a profitable result, with the partial-payout caveat already described. Capped Martingale uses a five-step ladder of 1, 2, 4, 8 and 16 FUN and resets after a fifth consecutive net loss or any net-positive result. This limits the stake ladder but is not a guaranteed loss cap, because those five bets already expose 31 FUN before returns.
D’Alembert adds one unit after a loss and subtracts one after a profit, never going below the base stake; it escalates more slowly than Martingale but drifts upward during long losing stretches. Fibonacci advances one step along the sequence after a loss and moves two steps back after a profit, producing escalation between Martingale and D’Alembert in aggressiveness. Paroli is a positive progression: it doubles after wins and resets after three consecutive winning steps or any loss, so it concentrates risk into hot streaks. The 1-3-2-6 system progresses through a fixed four-step ladder after wins and resets after any loss, aiming to compound a profit if the ladder completes. A completed four-win cycle is positive, but its variable profit may not recover losses from previous cycles.

Restart behaviour after stop limits is frequently misunderstood: a restart resets only the cycle reference point for the stop thresholds, while keeping the remaining bank and counting all subsequent paid drops in the same ledger. It does not refund losses or start a new session. None of these systems touches the per-drop probabilities. They redistribute when you win and lose, and how large the swings are, but the expected value of every individual drop remains the payout table’s weighted average, which sits below the stake.
- Fixed stake: constant 1 FUN, the measurement baseline.
- Percentage: 1 percent of current bank, 10 FUN at a 1,000 FUN bank.
- Martingale and Capped Martingale: doubling after losses; the capped variant runs a five-step ladder of 1, 2, 4, 8 and 16 FUN, exposing 31 FUN before returns.
- D’Alembert and Fibonacci: additive and sequence-based escalation.
- Paroli and 1-3-2-6: positive progressions that press wins instead of chasing losses.
Pattern Triggers and Fitted Strategies: Why the Edge Survives
A more sophisticated idea than staking is pattern triggering: only placing a large bet when recent history looks favourable. Three such hypotheses were tested on fresh data. Pattern A100 watches the previous five pocket distances from centre. If they match the sequence 1-2, then 3 or more, then 1-2, then 1-2, then 3 or more, it places one 100 FUN stake followed by eight ordinary 1 FUN paid drops. Patterns B50 and B100 trigger when the previous three distances are 4 or more, then exactly 1, then exactly 1, placing a single 50 or 100 FUN stake respectively followed by three ordinary paid drops. Pattern C25 triggers when the previous sixteen pockets contain at most one exact centre, placing one 25 FUN stake followed by three ordinary drops.
The mathematical verdict on all of these is settled before any data is collected. Because drops are independent, the conditional probability of the next pocket given any history of previous pockets equals the unconditional binomial probability. A trigger pattern only selects which drops you stake heavily on, and those selected drops have the same expected return as unselected ones. A pattern can change your variance profile, since you concentrate stake into fewer drops, but it cannot change the edge.
The same applies to parameter searches with a held-out suffix, the standard defence against overfitting. Fitting a strategy to historical drops and validating it on later drops protects you from fooling yourself about noise, but it cannot manufacture positive expectation, because there is no exploitable signal in independent draws to fit. Any fitted rule that appears profitable in-sample is riding tail variance, and the held-out section will show regression toward the same negative mean. This is the strongest reason to distrust any advertised Plinko system: the independence of drops is not a detail that cleverness can route around.
Large payouts
Has anyone won $50,000 on Plinko?
We have not verified a $50,000 cash payout from the BGaming version tested here. That is a limit of our evidence, not a claim that no player has ever received one. First identify the product: a television prize, a lottery award and an online multiplier payout are different events.
On a game offering a 1,000× payout, a hypothetical $50 stake would return $50,000, subject to that game’s stake and win limits. The net result of that one bet would be $49,950 before other bets, fees or taxes. It is an arithmetic example, not a documented winner or a suggestion to stake $50. A claim of ‘50,000×’ means a multiplier, not a $50,000 payment.
Our sample contains 3,000 completed demo drops, split into three 1,000-drop risk samples. FUN credits cannot be withdrawn. A large payout screenshot should be checked against the game version, stake, session losses and evidence of settlement. The recorded study reports only what its own rows can establish.
How long could a 1,000× Plinko payout take?
If—and only if—a 16-row game uses independent 50/50 steps and pays 1,000× at both extreme pockets, the chance per drop is 1/32,768. The chance of at least one such result in 1,000 drops is 1 − (1 − 1/32,768)¹⁰⁰⁰, approximately 3.01%. That is a model calculation, not a promise or our observed hit rate.
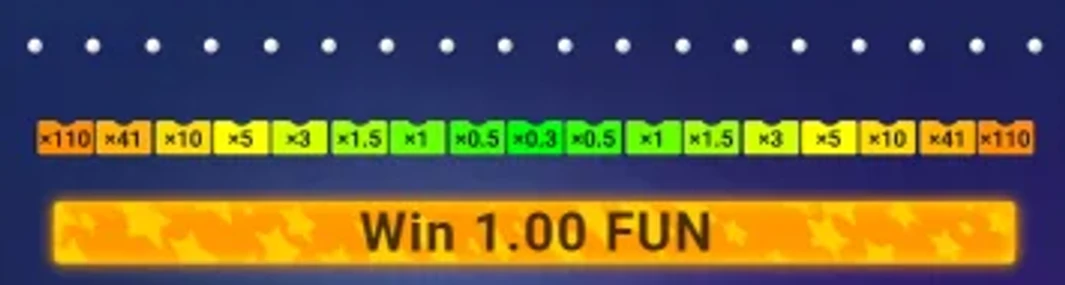
Even 32,768 drops give only about a 63.2% chance of at least one edge hit in that model. The average waiting time is not a deadline. A screenshot of a 1,000× return also does not show the complete session profit or prove a withdrawal. Check the stake, earlier losses, balance units and actual settlement separately.
Has anyone ever won $25,000 on Plinko?
We have not independently verified a $25,000 cash payout for the BGaming version in our study. Television prizes, lottery awards and online game returns are different claims. Our FUN-credit records cannot establish a cash winner.
For a game offering 1,000×, a hypothetical $25 stake would return $25,000 and earn $24,975 on that single bet, subject to the game’s stake and win limits. Earlier losses reduce the session profit. This explains the arithmetic; it is not a documented payment or a recommendation to stake $25. The same distinction applies to our historical strategy results: a replay balance is not money withdrawn.
Next steps
The Polish Context: Legality, Advertising and Sensible Caution
Poland’s finance ministry states that online casino games fall under the state monopoly, and a foreign casino licence is not Polish authorisation. This article is mathematical research conducted entirely in FUN demo credits; nothing here is a recommendation of a licensed Polish Plinko offer, and no route to bypass restrictions is endorsed. Polish public discussions have also described misleading Plinko app advertisements and fake celebrity endorsements; those allegations are not independently proven operator findings, but they justify treating any app promising guaranteed Plinko winnings with extreme scepticism.
The questions Polish users actually ask, whether Plinko apps really pay out, how to win without confusing return with profit, and whether a small budget can survive stake doubling, are all answered by the mathematics in this guide. Apps advertising guaranteed payouts contradict the binomial structure of the game. Return and profit differ because partial payouts dominate the centre. And a small budget struggles with Martingale because the capped variant’s five-step ladder alone exposes 31 FUN before returns, and the uncapped variant keeps escalating until the bank runs out, as the structure makes explicit.
If you want to explore any of this hands-on, the research hub links the calculator, simulator and recorded evidence in one place. Everything on this site runs in demo credits, and any separately rendered play button is an affiliate route whose availability for Polish users is unverified. The value here is the arithmetic: once you can compute pocket probabilities, waiting times and net results yourself, no advertisement can tell you a story the numbers do not support.
Plinko questions answered
What is the probability of hitting an edge pocket at 16 rows?
One specific edge pocket lands at 1 in 65,536 drops, because all 16 bounces must go the same direction. Hitting either edge is twice as likely at 1 in 32,768. At 12 rows either edge is 1 in 2,048, and at 8 rows it is 1 in 128.
Does a long run without an edge hit make one due?
No. Drops are independent, so the next drop always has the same 1 in 32,768 probability at 16 rows regardless of history. The expected wait of about 32,768 drops is an average, not a guarantee, and roughly 37 percent of 32,768-drop blocks contain zero edge hits.
Why do most Plinko drops lose money even with a high RTP?
The most common pockets pay below stake. At 16 rows the centre pocket lands about once per five drops and pays 0.5x, 0.3x or 0.2x depending on risk. These partial returns are net losses, and RTP averages them against rare large payouts over enormous samples.
Can Martingale or any staking system beat Plinko?
No. Staking systems change when and how much you bet, but every drop keeps the same negative expected value. Partial payouts also break the classic doubling recovery logic, and capped variants limit the ladder without capping the cost of the losses already incurred.
Why can’t a 1,000-drop session prove a strategy works?
Rare pockets occur about once per 32,768 drops, so a 1,000-drop sample usually contains zero of them and occasionally one by luck. A single 1000x hit swings the measured return by a full stake per drop, making small-sample results statistically meaningless for the tail.
Is Plinko legal to play for real money in Poland?
The Polish finance ministry states that online casino games fall under the state monopoly and a foreign licence is not Polish authorisation. This site uses FUN demo credits only, does not recommend bypassing restrictions, and does not present any route as a licensed Polish offer.