Start simply
Start here: three things to do
Choose Medium risk and a fixed 1 FUN stake for your first exercise. The question is simple: will the next ball return more than the stake? Enter your estimated chance, press Lock forecast, then Reveal drop. FUN is a virtual unit with no cash value.
After 25 drops, read three numbers: how often a profitable drop occurred, your net result and the result from staking 1 FUN every time. A returned amount of 0.5 FUN on a 1 FUN stake is a loss of 0.5 FUN. A return of 1 FUN is break-even, not a profitable drop.
The probability strip tells you what the model expects. The cumulative chart shows what happened in your short session. They need not match. Use the exercise to practise reading odds and following a chosen rule before trying the official Plinko demo.
- 1. Choose a risk level and one staking rule.
- 2. Record the chance before opening each result.
- 3. Compare the whole session, including every loss.
A profitable historical setting worth inspecting
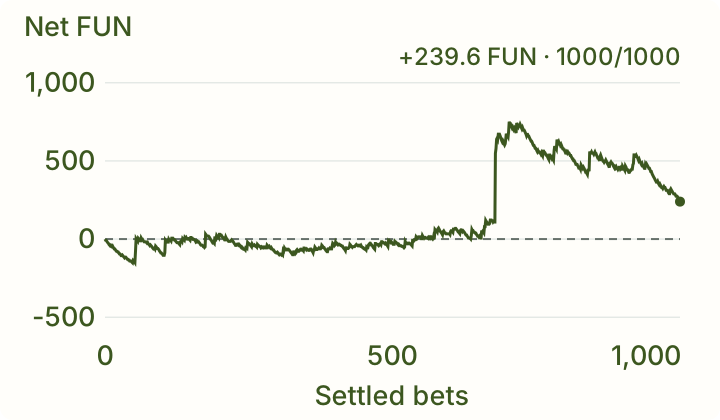
In this site’s Poland study, Percentage of bank at Medium risk finished +239.6 FUN over 1,000 historical drops. Maximum drawdown was 511.5 FUN. It was selected after inspecting those results; it is not a forecast for a fresh session.
Open those settings in the strategy simulator and inspect the whole curve. Look for the largest stake, the deepest drawdown and how many drops were actually played. Two strategies can finish on the same profit while exposing very different amounts of the bank along the way.
The useful next question is whether the rule survives results it has not already seen. Keep the rule unchanged for that test. If you adjust it after inspecting the new losses, those results become part of your fitting data. They no longer provide an untouched check. Our recorded study and separate replay results show the distinction.
This historical rule opens in the full simulator with its original settings. The manual trainer above offers four smaller practice rules; its 1–2–4 progression is not the same configuration as every historical example.
Open this historical example in the simulator →
What to do, in plain language: Use 1% of the current bank for each drop, rounded down to whole FUN and capped at 100 FUN.
How to repeat these settings
16 rows · Risk: Normal · Starting bank: 1,000 FUN · Stake cap: 100 FUN.
- Before each drop, multiply the current bank by 1%.
- Round down to whole FUN. Use at least 1 FUN and no more than the 100 FUN cap.
- Recalculate after every result. The first stake is 10 FUN for the 1,000 FUN starting bank.
A win here means a return greater than the stake. A partial return is a loss; a return equal to the stake is break-even.
Stop if the next required stake exceeds the cap or available bank. Do not silently reduce it or add money: that changes the tested rule.
FUN is a virtual unit. To reproduce the proportions, scale every stake, bank and limit by the same factor; game minimums and rounding can prevent an exact match.
Affiliate link · check the game, rules and local availability.
Our 3,000 demo drops: probability versus observation
Use the trainer
How to practise probability estimates manually
The trainer starts with 1,000 FUN, a base stake of 1 FUN and a maximum stake of 4 FUN. Select 25, 50 or 100 drops before starting. A fixed stake is the easiest first comparison. Later, try the capped progression or Paroli while leaving the probability forecast unchanged. That separates a change in exposure from a change in predictive accuracy.
For every drop, record a percentage between 0 and 100 for the event “return above 1×”. An estimate of 20% means roughly one such outcome in five comparable independent attempts over a long run. It does not mean the fifth attempt must succeed. Optional notes let you write why you changed your estimate before the result is revealed.
Locking records the estimate and the next stake. Only Reveal drop generates the fresh model outcome. You cannot edit that forecast after locking. The last few visible multipliers are past results; they can help you test a pattern idea without showing future outcomes. The experiment is local to this page and has no connection to a casino account.
Export the CSV before starting a new session or closing the page. It contains every settled drop, forecast, payout and both running results. This is a practice notebook, not an independently audited forecast record: browser data and downloaded files can be edited. Keep unsuccessful sessions when comparing a rule over time.
Read the result without confusing accuracy and profit
The observed profitable-drop count is compared with the count expected from the selected model. A typical range is calculated for the number of drops you have actually completed. It is a central 95% prediction range under the model assumptions. Some valid sessions fall outside it; being inside it does not prove that a game or a strategy is fair.
The forecast error compares your percentages with what happened. For each drop, turn your forecast into a fraction, subtract 1 if the drop was profitable or 0 otherwise, then square the difference. Average those values. This is the Brier score: smaller is better, and a perfect record scores 0. The reference uses the exact model probability on the same outcomes.
For example, predicting 20% gives an error of 0.64 when the event occurs and 0.04 when it does not. A single correct confident guess can look impressive. Compare the average after the whole planned exercise. A lower score on one short run is still not evidence that you can predict a real provider’s next result.
The bankroll chart has completed simulated drops along the bottom and cumulative net FUN on the left. The solid line is your selected staking rule; the dashed line is a fixed 1 FUN stake on the same outcomes. Above zero means profit for that model run. A point at 25 and −5 means a 5 FUN loss after 25 drops, not a 5 FUN payout.
Here is a worked comparison you can calculate without software. Imagine 25 High-risk drops at 1 FUN each: 20 return 0.2× and five return 2×. Total stakes are 25 FUN. Returns are 4 FUN from the small payouts plus 10 FUN from the five larger ones, giving 14 FUN returned and a net loss of 11 FUN. Five profitable drops out of 25 is 20%, close to this model’s 21.01% probability.
Now replace one of those five 2× outcomes with a 26× outcome, keeping every stake unchanged. There are still five profitable drops, so the profitable-drop frequency stays at 20%. But total returns become 38 FUN and net becomes +13 FUN. The sign of the session result changes even though that simple frequency statistic does not. This is a hypothetical arithmetic example, not an extra measured batch.
A constant forecast of 20% receives the same Brier score in both examples, because both have five positive events and 20 non-positive events. The score is (5 × 0.64 + 20 × 0.04) / 25 = 0.16. That score checks the event you actually forecast. It does not evaluate a forecast for the exact multiplier. Keep the question precise when comparing a prediction service’s claimed accuracy with its claimed profits.
Understand the probabilities
Why the Plinko board looks like a bell curve
Optional: the maths behind this result
Imagine 16 independent left-or-right choices, each with a 50% chance. The pocket number counts how many choices went right. Pocket 0 requires all lefts; pocket 16 requires all rights. Many different paths lead to the middle, but only one path reaches each extreme. That is why central pockets are much more likely in this model.
The exact distribution is binomial. For 16 rows, the chance of pocket k is C(16,k) divided by 65,536. The letter C counts combinations; you do not need to calculate it to use the chart. Pocket 8 has 12,870 possible paths, giving about 19.64%. Each outer pocket has one path, about 0.001526%.
The familiar bell shape is a useful picture, but the smooth normal or Gaussian distribution is only an approximation to these discrete pockets. The mean position is 8 and the standard deviation of position is 2 pockets. That describes where the ball lands, not the spread of money returned. Do not use a rounded bell curve to estimate an extremely rare edge precisely.
The probability bars run from the left pocket to the right pocket. Taller bars mean more likely landings. The labels show the multiplier paid at that pocket under the selected risk. Colour identifies profit, break-even or loss on one drop. A tall bar can therefore represent a common losing result; payout size and landing frequency are different things.
Expected return, variance and the cost of exposure
Optional: the maths behind this result
To calculate expected return, multiply each pocket’s return multiplier by its landing probability, then add the 17 products. In our 16-row model with the captured payout tables, all three risk levels return approximately 98.98–99.00% of the amount staked in expectation. These calculated model values are not the observed return of your short exercise or a promise for every Plinko version.
The expected net on one 1 FUN stake is therefore about −0.01 FUN. On 100 such bets, expected net is about −1 FUN. A real simulated session can finish above or far below that number. Increasing the stake multiplies both a possible payout and the expected cost of the exposure; it does not improve the underlying chance of the chosen pocket.
Variance measures how widely outcomes spread around their average. Standard deviation is its square root, in the original units. For the captured 16-row tables, a 1 FUN bet has payout standard deviation of about 0.33 FUN on Low, 1.47 FUN on Medium and 6.57 FUN on High. High therefore has a much wider spread despite a similar expected return.
The chance of a strictly profitable drop also changes with the table. It is about 45.45% on Low and 21.01% on Medium or High in this model. On Low, about 34.91% of drops return exactly the stake. On High there is no break-even pocket. Read the payout table alongside the probability, rather than judging a setting by the biggest printed multiplier alone.
Does a losing streak make a win more likely?
Optional: the maths behind this result
In the independent model, previous landings do not change the next landing probability. Five central hits do not move probability towards an edge. For the selected event, the conditional chance after that streak is the same as the original chance. Changing a stake after the streak changes the amount exposed, not the distribution of the next outcome.
The law of large numbers concerns averages as the sample grows. It does not require the next few balls to repair a losing session. Even while average return moves closer to its expectation, the accumulated loss in FUN can keep growing. A short streak of wins also does not establish that the model has changed.
On High risk, each outer pocket pays 1,000× in the captured table. The chance of either edge is 2/65,536 per model drop. Across 1,000 independent drops, the chance of at least one edge is about 3.01%. Around 96.99% of such batches have no edge at all. “One in 32,768” is an average rate, not a countdown.
To test an idea such as “increase after three losses”, write the trigger, increased stake and reset condition first. The exercise offers a small capped example. Every observation is a paid virtual drop, so its losses remain in the result. The full betting-system comparison covers larger rule families and their limitations.
Apps and signals
Plinko predictor apps, APKs, bots and signals
A predictor app claims to identify future outcomes; a simulator generates or replays outcomes under stated assumptions. A bot can automate a staking rule without predicting anything. A screenshot showing a winning multiplier does not tell you which of those jobs a product performs. Ask what its forecast was, when it was recorded and which game and settings it concerns.
An APK is an Android installation file, not proof of access to a game’s future results. We do not have verified prospective evidence that a named predictor can beat the provider. A product asking for account passwords, private keys or a payment to unlock a guaranteed win has not demonstrated prediction accuracy.
A serious signal test includes all calls made before outcomes, missed calls, costs and a baseline. For this trainer’s Medium setting, always guessing “not profitable” would be right about 78.99% of the time in expectation. Advertising 75% accuracy would be unimpressive against that baseline. Accuracy alone also ignores the size of each stake and payout.
For a version offering provably fair verification, checking a completed result against its published method serves a different purpose from forecasting the next one. This trainer does not verify an operator’s seeds or reproduce its private implementation. Its assumptions and probability table are visible so you can inspect the model you are actually using.

A search for a predictor tied to another provider does not make this table transferable. Check the exact game, row count and payout strip first. An educational Plinko probability simulation can illustrate a distribution without reproducing any casino product. This exercise uses our captured BGaming payout table with an explicit independent mathematical model.
Choose your next test
Take one clear rule into a new practice session
Keep the risk, stake rule and planned length unchanged until the exercise ends. Save the file, then repeat on a new sequence without deleting the losing attempt. If you tried several rules and publish only the best run, the apparent winner benefits from selection. Count the failed experiments when deciding what the result means.
Use the Plinko settings guide to understand the real controls and the odds calculator for other row counts. Our manual trainer fixes 16 rows, so it is not a forecast for a different board. The official demo is the place to practise the provider’s actual interface; the simulator is where you compare recorded and modelled strategies.
If you then inspect partner games, check the actual game, local availability and displayed rules before deciding to play. A training balance is not withdrawable money.
Plinko questions answered
Does a Plinko predictor know the next ball?
This trainer estimates probabilities and checks forecasts on simulated drops. It does not know a provider’s next result. A profitable replay of past drops does not establish future predictive ability.
Can I predict Plinko manually?
You can record a probability estimate and a staking decision before a result, then compare them with a clear baseline. In this independent model, previous drops do not change the next pocket’s probability.
Why can a profitable strategy have poor forecasts?
Profit depends on stakes and payout sizes as well as which outcomes occur. One rare large payout can outweigh many losses. Forecast quality and bankroll performance are therefore shown separately.
Does the bell curve guarantee a middle landing?
No. In the 16-row model the central pocket has probability about 19.64%, so most drops land elsewhere. The binomial distribution describes frequencies across comparable trials, not a guaranteed route for one ball.
Is this a Plinko probability simulator or a predictor app?
It is a probability simulator and a manual forecast notebook. Like an educational board, it can explain a distribution. It adds stakes, payout tables and a fixed-stake comparison, but does not obtain a casino’s next result.